
When you think of derivation, what comes to mind is generally jumbled up numbers and complex calculation that would have one pulling their hair out. Still, many of you would have pondered over how to find standard deviation. In such a situation the idea of calculating standard deviation through hand would just sound ludicrous. Though it is really useful to know how to find standard deviation on excel.
What is more surprising is that any professional statistician would never want to calculate deviation on hands. The reason for this being that derivation is a complex form of calculation and a statistician always looks for accurate result. The chances of mistakes are a lot more where the calculations are complicated, and it also slows down the entire process.
Statisticians depend on spreadsheets and computer programs to handle such numbers; this also eliminates chances of any mistake and is less time consuming. In such a case why should one even bother to calculate standard deviation by hand? The answer is simply to gain valuable insight on how the process works. To go through the crux of the method one would see how this calculation is carried out. Once you are able to understand the process of derivation, the numbers given by our spreadsheet or computer program will not look complex but rather you would know how they were generated.
How To Calculate Standard Deviation
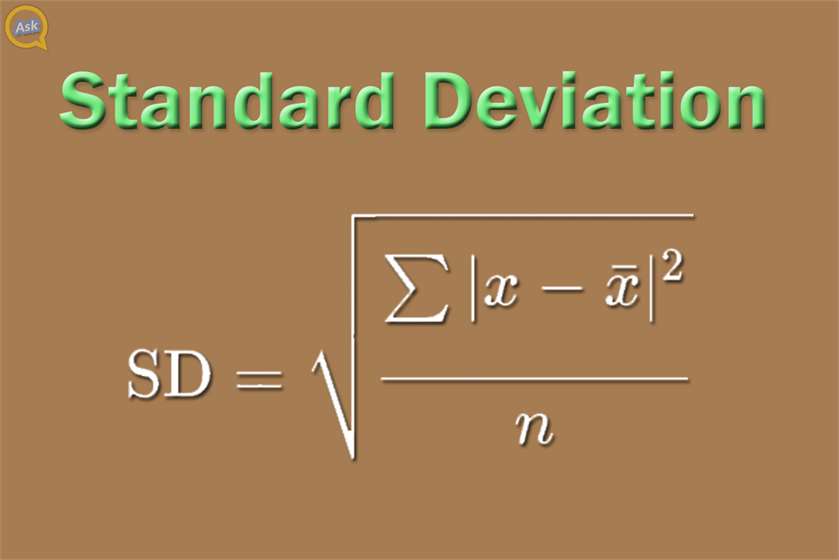
The formula which is used to derive standard derivation is mentioned below.
(Image Courtesy: Khan Academy)
The formula may look complex but it can be easily simplified and in order to do that let's explore a step by step explanation approach.
The first thing that we are going to do is find the mean, then for every data point, we are going to find the square of its distance to the mean. The values generated would be summed up and divided by the number of data points. Take the square root of this figure.
An example of how to calculate standard deviation
Let’s pick some numbers to better understand the process without getting confused. Some easy numbers would be 6,2,3,1
Step 1:
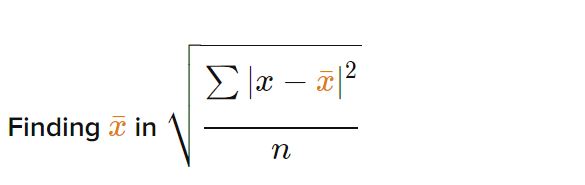
(Image Courtesy: Khan Academy)
Here we calculate the mean of the data set, which is represented by x.
Step 2:
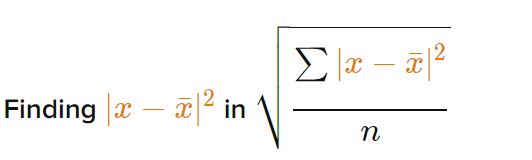
(Image Courtesy: Khan Academy)
Find the distance from each data point to the deviations and then square each of the distance to get the desired results.
Let’s take an example, if the first data point is 6, the mean is 3 then distance automatically becomes 3. Now, when you square the distance, you get 9.
Look and compare the table below :
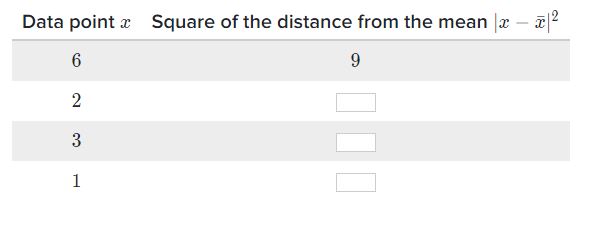
(Image Courtesy: Khan Academy)
Step 3
(Image Courtesy: Khan Academy)
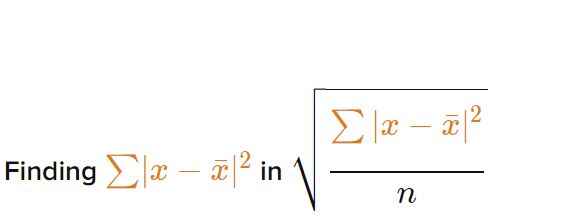
The meaning of the symbol ∑ means "sum," so, in this step, we add the four values generated through step 2.
Step 4
(Image Courtesy: Khan Academy)
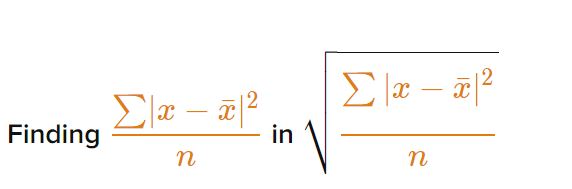
Here we divide the sum obtained from Step 3 by the variable n, which represents the data point.
Step 5
(Image Courtesy: Khan Academy)
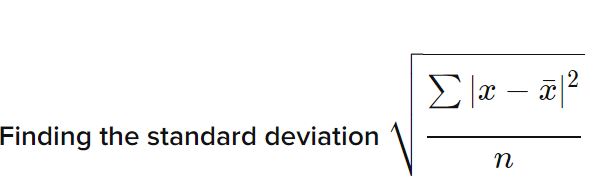
The last step is just to take the square root of the answer generated from step 4.
Congratulations! You have finally calculated the standard deviation of a small data set.
Were you able to calculate standard deviation easily now? Do lets us know through the comment box below.

41 Opinions

10 Opinions

8 Opinions


