
In simple terms, Chi Square Test is a statistical method used to investigate the likeliness of an observed distribution emerged due to chance. It examines how well the distribution of observed data fits with the expected distribution in case the variables were independent. That is why the Chi Square Test is also commonly known as the 'Goodness of Fit' test.
The Chi Square Method deals with categorical data, meaning that the data which has been accumulated is categorized. Therefore, the Chi Square Test does not work with parametric or continuous data. An interesting application of the Chi Square Test is that it can be used to deal with the issues of fairness and cheating in games that are related to chance, such as dice games, roulette, and card games. Furthermore, it is used in testing of a statistical hypothesis like testing for the normality of residuals.
What Is Chi-Square Formula?
The Chi Square formula, which you can use to determine whether there has been cheating or the observations are a result of fair play, is
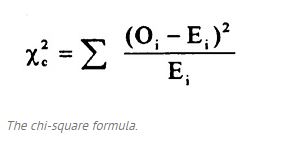
(Image Courtesy: Statistics How To)
Where ‘c’ in the subscript is the degree of freedom, ‘O’ is the value which has been observed, and ‘E’ is the value which was expected. The summation symbol here indicates that you will have to perform the calculation for each data unit.
Chi Square Example
To understand the concept better, let’s take an example.
In a seminar attended by 256 people, a survey was conducted to find out their zodiac sign. The following data was collected from this survey:
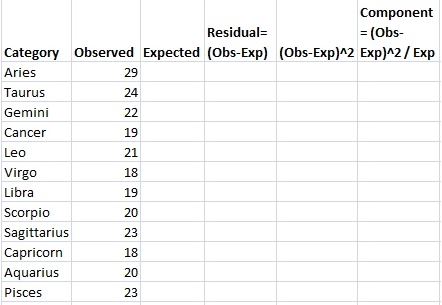
(Image Courtesy: Statistics How To)
Now, we would expect that the zodiac signs would be evenly distributed, so if there are 256 people in total and there are 12 zodiac signs. Therefore, by dividing 256 by 12 we get 21.333.
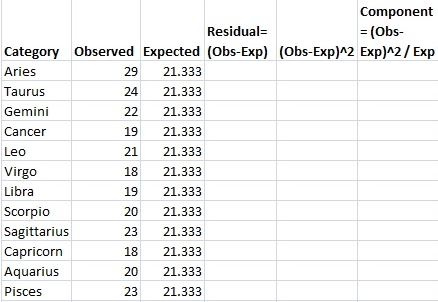
(Image Courtesy: Statistics How To)
Now, by subtracting the expected value from the observed one and squaring this residual value, we get
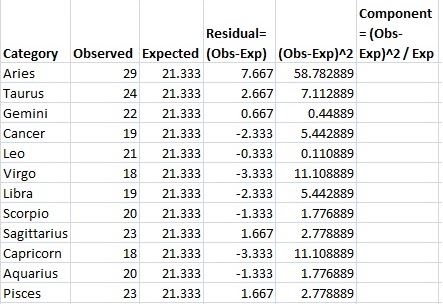
(Image Courtesy: Statistics How To)
And by dividing the squared value of residual by the expected observation, we get
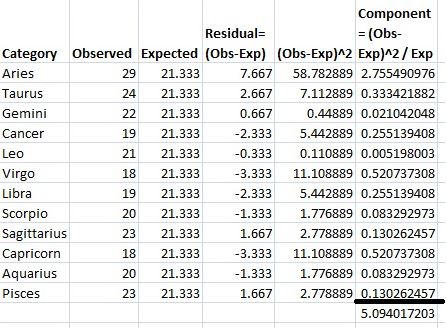
(Image Courtesy: Statistics How To)
As shown above, the Chi Square Statistic in this case in 5.094017203.
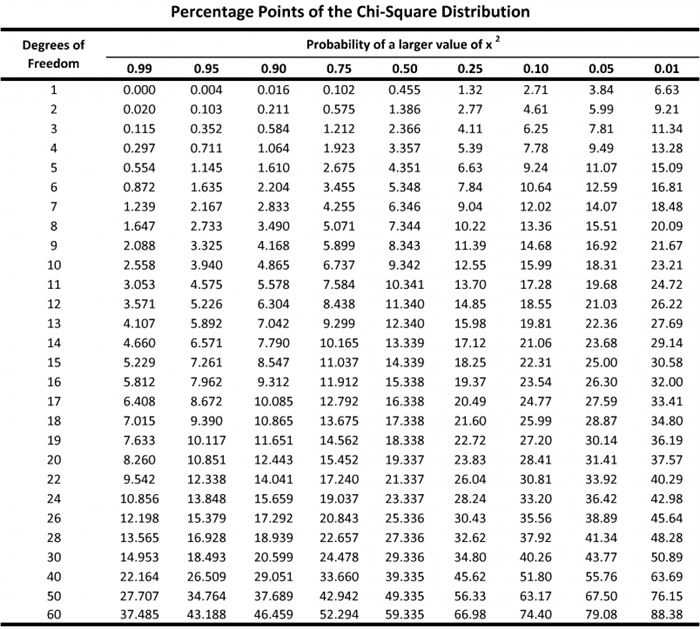
After you have found the Chi Square Statistic, what you need to do next is locate this value on the P-Value for T Table, which looks like:
(Image Courtesy: Plant and Soil Sciences eLibrary)
Now, Degree of Freedom in any distribution is 1 subtracted from the total number of possible outcomes. Since the number of possible outcomes in the given Chi Square example is 12, the 12 zodiac signs, the degree of freedom here would be 12 – 1 = 11.
What you need to do next is ascertain where the value of 5.094 lies on the P-Table for the degree of freedom 11. This p-value, which comes out to be 0.9265 in our case, helps in accepting or rejecting the null hypothesis. Since our p-value is .9265, it means that there is a 92.65 percent chance that our null hypothesis that the zodiacs are evenly distributed was correct and there is no need to reject it.
If you are starting out with some basic level statistics, maybe you would like to learn about median and mean first.
We hope to have cleared all your doubts regarding this complex statistical concept. Share your opinions about the post through your comments in the dedicated box below. We would love to hear from you.
(Featured Image Courtesy: SPH - Boston University)

264 Opinions

40 Opinions

66 Opinions

26 Opinions