

In statistics, the mean is the average of a set of data or series of numbers. To find the mean, we sum all the numbers and divide them by the number of items in the set.
The method looks easy but it gets a little tricky with variations in the number series. If you thought that calculating standard deviation was the most difficult one you came across till now, wait till you finish reading this one.
#1. How to Find the Mean in Excel
In the case of large data, using excel is the easiest way out. Here are the simple steps to find mean using excel.
- Use the "AVERAGE" function in Excel to find the average of a set of numbers. Enter the series of figures in your Excel spreadsheet. Click on the box where you want the mean or Average to appear.
- Click "Formulas" and choose the "Insert Function" tab. Enter the numbers in your Excel sheet in a row or a column whichever way you want it to appear in.
- Scroll down and select the "Average" function.
- Enter the cell range for your list of numbers in the 1st box, for Eg: C4: C13 and then click "OK."
- The mean for the list will appear in the cell that you selected.

(Image Courtesy: OWL)
#2. How to Find the Mean of a Histogram
One can calculate both the mean and the median using a histogram.
- For each histogram bar, start by multiplying the central x-value to the corresponding bar height.
- Each of these products corresponds to the sum of all values falling within each bar.
- Add all the products to get the total sum of all values
- Finally, divide it by the number of observations to find the mean.

(Image Courtesy: Original)
#3. How to Find the Mean of a Sampling Distribution
If you draw all possible samples of size 'n' from a given population and further compute a statistic for each sample, then the probability distribution of this statistic is called a sampling distribution.
The variability of a sampling distribution is calculated by its variance or its standard deviation. Its variability depends on three factors:
N: The number of observations in the population,
n: The number of observations in the sample,
And the way that the random sample is chosen.
The mean of this sampling distribution (μx) is equal to the average of the population (μ). And the standard error of the sampling distribution (σx) is measured by the standard deviation of the population (σ), the population size (N), and the sample size (n). These relationships are shown in the following equations:
• μx = μ
• σx = [ σ / sqrt(n) ] * sqrt[ (N - n ) / (N - 1) ]

(Image Courtesy: SlideShare)
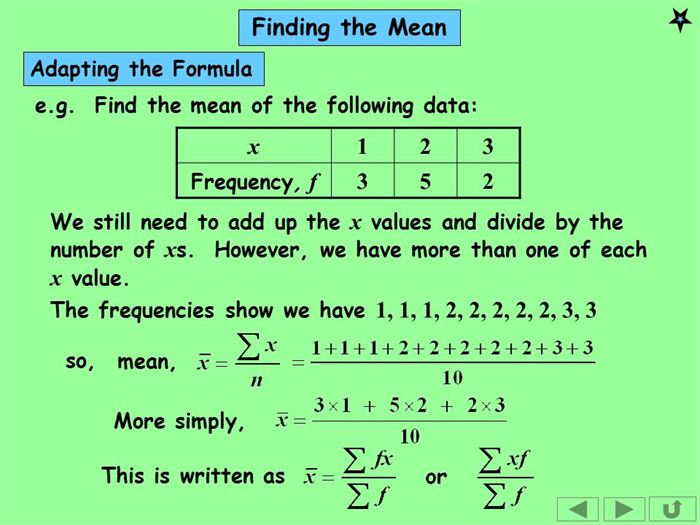
#4. How to Find the Mean in Statistics
To find the mean from a given statistics just follow these simple steps.
- Line the numbers in order so that they are understandable.
- Add the numbers up to get a total. (Eg: 2 +19 + 44 + 44 +44 + 51 + 56 + 78 + 86 + 99 + 99 = 622)
- Keep this number aside for a while
- Now count the amount of numbers in the series. (Eg: 2, 19, 44, 44, 44, 51, 56, 78, 86, 99, 99, there are 11 numbers)
- Divide the number you established in step 2 by the number you found in step 3. (Eg: 622 / 11 = 56.5454545.)
- This is the mean of the series provided. It is also called the average.
(Image Courtesy: Slide player)
Did you know all these methods of calculating mean? Let us know in the comment section below.
(Featured Image Courtesy: Code School)

41 Opinions

10 Opinions

8 Opinions


